Lower Carbon and Reduced Greenhouse Gas (GHG) Emissions Reporting Made Easy
Logistics carriers across every mode and fleets of all kinds are increasingly adopting their own lower carbon reduction targets – some even committing to net zero by or before 20501. If you’re a carrier or fleet who hasn’t yet adopted targets, you’re likely feeling the pressure to demonstrate lower carbon efforts. If you’ve encountered an RFP that requests information about your ESG or carbon reduction efforts, you may feel disadvantaged against other market competitors who do have set goals.
Regardless of your progress, Chevron Renewable Energy Group can not only help you work toward lower carbon targets and can help reduce CO2 GHG emissions, but can help you track and quantify that reduction with our quarterly GHG emissions reporting.
Get Started Today
Connect with one of our experts for more information on pricing, availability, product information, logistics or if you just have a general question.
Connect
Carbon reduction reports from Chevron Renewable Energy Group
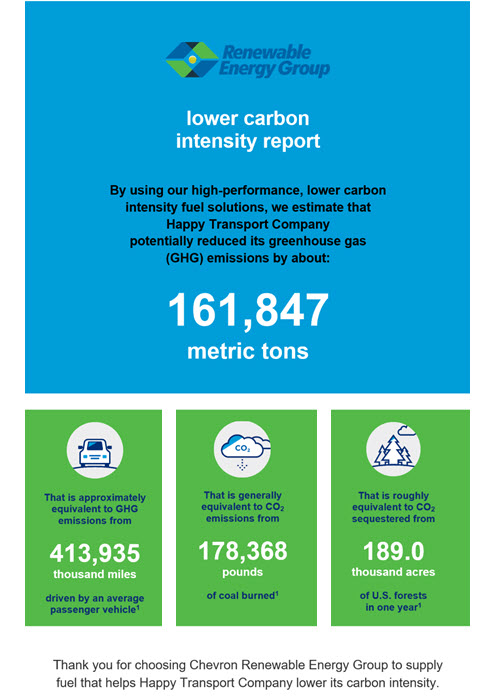
Each quarter, we provide our customers with a lower carbon summary report that estimates the metric tons of GHG emissions avoided by using higher performance, lower carbon fuel solutions from Chevron Renewable Energy Group. This report estimates GHG emissions reduction, going back to 2021. Additionally, the report provides some relatable equivalents for comparison purposes, including:
- The approximate number of miles it would take for a passenger car to emit a similar amount of greenhouse gases.
- The approximate amount of coal burned (in pounds) it would take to emit a similar amount of CO2.
- The approximate number of acres of U.S. forests it would take to sequester a similar amount of CO2 in a year.
Try our carbon emissions calculator
Another tool at your disposal is our CO2 emissions calculator. Simply enter your fuel application (truck, rail, marine or power generation), the timeframe (month or year), your unit of measure (gallons or liters), your fuel consumption levels and the percentage you want to convert to bio-based diesel. We’ll calculate the estimated reduction of Scope 1 fossil CO2 emissions in metric tons.
Put our reports to work for you
Whether you need data to support your company’s ESG reporting requirements, or you’re looking to set your company apart in the RFP process with a customer that tracks Scope 3 emissions — our reports can help take your company to the next level. Want to see these reports customized to your needs? We can help with that, too.
Now let’s look at just how much you can potentially reduce your emissions by transitioning to bio-based fuels.
Biodiesel emissions vs. diesel emissions
The impact realized in the reduction of CO2 GHG emissions when switching to biofuels from petroleum diesel can be significant, depending on the size of your fleet. For instance, by switching to Chevron Biodiesel — fleets can expect to reduce engine emissions by:
- Up to 100% for fossil carbon2
- Up to 70% for total hydrocarbon3
- Up to 70% for particulate matter3
To put this in perspective, if you’re a small to medium-sized trucking company that uses 1 million gallons of diesel fuel per year, and you switch your entire fleet to biodiesel, you can reduce your annual Scope 1 fossil CO2 emissions by an estimated 9,990 metric tons.4 By comparison, it would take approximately 1.65 million mature trees to sequester that much carbon in a year.5
Scope 1, 2, and 3 emissions defined
Scope 1 emissions
These are defined as direct emissions from owned or controlled assets, which includes on-site natural gas combustion and the fuel used in a vehicle fleet. These are the emissions that most organizations with carbon reduction goals tend to focus on and report on, as they have the most control over these emissions. This is where Chevron Renewable Energy Group can help you with carbon reduction metrics.
Scope 2 emissions
These are defined as indirect emissions from purchased energy. In other words, if you consume electricity in a state whose power is generated from a high percentage of renewables, your scope 2 emissions will be lower than if you’re in a state with a higher percentage of power generation from fossil fuels.
Scope 3 emissions
These are defined as all other indirect emissions that occur across an organization’s value chain, which includes (among other things) transportation of the organization’s purchased and sold goods. While most organizations with carbon reduction goals focus first and foremost on reducing Scope 1 emissions that are within their control, a recent survey indicated that 58% of Fortune 500 companies have goals to reach net zero by 2050, and of those 58%, roughly half of them have plans in place to reduce Scope 3 emissions.6
the transportation and logistics industry, this means those carriers with data to show how they’re reducing carbon will have a competitive advantage over those who do not have that data to share with potential customers who track Scope 3 emissions.
Ready to get started?
Contact us to discuss how we can be your lower carbon partner.
Footnotes and sources
1. https://www.carbon.ci/
2. Product is produced from renewable oils and fats. Methanol used to make biodiesel and hydrogen used to make renewable diesel and SAF are typically made from conventional natural gas, but can be produced from renewable resources
3. CARB Assessment of the Emissions from the Use of Biodiesel as a Motor Vehicle Fuel in California "Biodiesel Characterization and NOx Mitigation Study." Durbin (2011)
4. https://www.regi.com/services/emissions-calculator
5. Calculation based on estimate of 0.006 metric tons sequestered per tree per year. Source: https://8billiontrees.com/carbon-offsets-credits/carbon-ecological-footprint-calculators/how-much-carbon-does-a-tree-capture/
6. https://fortune.com/2022/06/15/climate-change-carbon-emissions-net-zero-goals/